Geospatial in the time of AI
In the era of artificial intelligence, geospatial technology emerges as a powerful tool. Through the fusion of geospatial data and AI algorithms, a profound understanding of our planet's complexities can be unlocked. This symbiosis offers new efficiencies and synergies for traditionally very hard use cases, such as applying a model across the whole territory of a country and collating all the results back into a geospatial data product - a map.
I am biassed, I love a good map, whether it is a digital map on my screen or a more traditional paper map that folds nicely and fits into your pocket. A map is such a natural and efficient medium for communicating data patterns - yet in many organisations it is considered either a niche topic or one too hard to master at scale.
Harnessing geospatial to address global challenges
Geospatial systems play a crucial role in modern ecosystems and they cater to many different needs.
These needs range from urban planning and development, environmental preservation, defence, disaster management, and many more. These use cases feed into many very important initiatives.
Sustainability is one of the big questions our society is yet to answer and geospatial systems are a major force in this domain, whether we need to track the amount of emissions across different regions or how water temperature has evolved over the last century.
Environmental preservation is another great example, spatial data can be used to track deforestation patterns or coral bleach areas. Most of these use cases leverage aspects of data collectively referred to as Earth Observation Data.
Earth observation (EO) data collectively refers to global geospatial data assets that are collected over prolonged periods. Most common examples would be Sentinel Data or Copernicus Data, Weather and Climate Data, Seabed Data, etc. EO data is usually very high in volume as well as high in complexity.

For example, we could collect air pressure and temperature as well and we could collect this for each day over 3 years. This would result in a 3285 band image. As soon as we’re in this domain most of the users without years of experience in Geospatial domain find themselves uncomfortable and lost.
How can we democratise geospatial data?
One way to democratise this data is to build tools that look and feel familiar while they maintain the power to handle such complex data sources. Luckily, geospatial as a topic has been around for ages and there are a lot of tools to sample from. However, many of these tools assume the users are very familiar with the geospatial domain.
One such tool is GDAL and it is probably the most powerful framework for handling geospatial data out there. On the other hand, there are tools such as PostGIS that provide a SQL interface and allow for easy interaction. But there is a catch: you’d need to deploy and manage this service yourself and on top of that you’d need to make sure this service is integrated with the rest of your platform.
But what about Python users, R users, or Java users? An alternative to the hurdles of managing different stacks for every language your platform needs to support would be to centralise around a package called Mosaic. The aim of this package is to democratise spatial data but also unify it around a notion of spatial grids. For global context that grid would be H3 and for local UK context that would be the British National Grid.
Mosaic provides unified APIs for SQL, Python, Java/Scala and R which means if a procedure is implemented in R it will work exactly the same way in Java as well. All of the APIs are declarative and SQL-like which makes the procedures easy to read and understand. It provides 100+ common operations that allow the users to slice and dice those very complicated 3000+ band images, join different sources, clip these rasters against areas of interest and apply ML or Foundational models on top of this data.
The best part is that the data produced using this framework enforces the outputs to respect the grid of choice meaning that any other organisation using the same framework can combine their own data with your data products. This promotes FAIR principles and makes sure data flow isn't interrupted.
Adapting to data diversity
And this data flow is what matters the most. In the modern settings with new ways of extracting value from data being invented every day, such as Gen AI and Foundation Models, we need to be ready to consume data of all shapes, sizes and forms and be ready to apply these new technologies on top of the data. And what better data than the data describing the world we live in. Many new models are appearing as we speak; Segment Anything Model (SAM) by Metta or Prithvi by NASA and IBM are stellar examples. These models can handle imagery and spatial/aerial imagery at unprecedented flexibility and power. And it gets better. We can plug these together with Large Language Models and start interacting with our data through human language - “Please give me all trees in this area as a map”, yes this is a real use case we prototyped with one of the organisations in the UK Public Sector.
Whilst the above sounds like a gadget from an episode of Star Trek, it is actually a feature of our reality. But it isn't something one can deliver without the right platform and right set of ingredients. The magic formula I used was Databricks, Hugging Face, Lang Segment Anything, Mosaic for geospatial operations and 12.5 cm aerial imagery over the UK.
It was possible to get from raw data to a map of trees over an area in an afternoon. And before your imagination turns on the engines and sets to hyperdrive, this was a prototype. The model was able to identify trees with high precision but not all trees were recognised as trees. As any other model out there, it wasn’t perfect but it was mighty good.
This type of tooling can easily unlock automated survey use cases, since we can very quickly get a very good training dataset with minimal manual interventions. Using the outputs of this process we could build another specialised model that can capture more trees very easily using ML tooling.
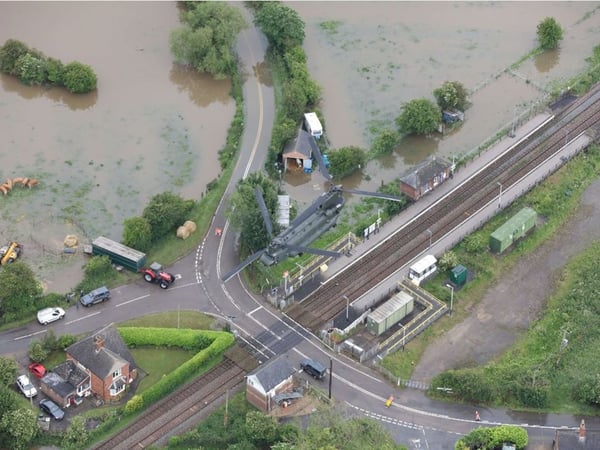
Another great example is building a flood risk model leveraging modern tooling. I have worked on this with several organisations in the Insurance and Asset Management domain. The approach we took was to get our hands on as many different spatial datasets as possible, ranging from geology information, aerial footage, weather data, physical assets, and more. We then took all of this data and projected it onto a grid of choice (BNG or H3).
Once we had the data in the unified form it was very easy to join these disparate datasets one to another. The grid allowed us to traverse river basins up and down very easily and generate new variables that describe the environment of different assets, also it allowed us to define proximity areas and define variables over those. Once we had enough variables we used AutoML in Databricks and got a Risk Model in under 2 hours.
This was the quickest way to achieve a baseline model, anything that we should do further should yield better results. And if nothing is better, then great – we already have a good answer.
The two use cases I covered in detail are very different but they share similar threads, both require tooling that can handle complex geospatial data assets and both leverage ML techniques, whether those are GenAI or traditional ML techniques.
Finally, both of these use cases are answering important questions about our environment. In one case that was the flood risk contours and in the other automated surveying of trees.


.jpg?width=600&name=20201110_085942%20(2).jpg)
).jpg?width=600&name=Thalia%20Baldwin%20(Presentation%20(169)).jpg)